Sunday, August 10, 2014

GIS 4102 Module 11 - Sharing Tools

Sharing tools was the subject of the final module for GIS Programming. After modifying a script so that it could be embedded right into the pertinent tool, the script was embedded and then password protected. Embedding a script directly into the tool improves the ease with which the tool can be shared. Password protecting the script prevents anyone from viewing or exporting the script without the password. The tool's dialog box and the results from this module's embedded script can be seen here:
Results from Embedded Script and Tool's Dialog Box

Initially working with Python was frustrating, but continuing with it was fruitful. It quickly became obvious that the more Python is used, the easier it is to use and understand. While there still are several things that are not clearly understood, finding the right resource for clarification is becoming quicker. Implementing what has been learned will be important to retaining it.

And just in case anyone is wondering...having your elderly parents actively test the local hospital's emergency room to see if they will provide services at 2-for-1 cost for seniors just before final exam is not conducive to completing course work in a timely fashion. I'm just saying. (Both are fine now and in their own home again.)

Good luck to everyone in their Python and GIS endeavors!

Wednesday, August 6, 2014

GIS 4048 Final Project: Conservation Subdivision Parcel Selection

A group of developers requested assistance with locating vacant parcels in Orange County, Florida, that are suitable for the development of a conservation subdivision. Conservation subdivisions reserve about 50-70% of the buildable land for open space and group the homes on the remaining portion. Conservation subdivisions have higher home values and reduced infrastructure costs (including lower stormwater management needs), benefit wildlife, and provide open space to residents (Allen, et al., 2013). It is a win-win situation. The objectives of the project were to obtain a list of suitable parcels, calculate Euclidean distances based on clients' preferences (near major roads and conservation lands, away from airports, energy plants, and landfills), perform an intersection to remove parcels that could not be used for subdivision development, conduct weighted analyses, determine three vacant parcels that meet the criteria, and provide the results (maps, spreadsheet, and report of parcel information with owner contact information) to the clients.
Such an extensive task seemed quite daunting at first. Deciding what to take on as a project alone was time-consuming. This was a good, practical experience as I learned that finding necessary, accurate, and complete data can be quite difficult at times. Having polygons for the parcels instead of a single point for each parcel would have been more informative for the clients. Along the way there were several accidental discoveries about ArcMap's quirks which I hope to avoid with future projects. Although it was extremely time-consuming, I really enjoyed working on this project. I haven’t done any subdivision work for decades and was excited to discover the concept of conservation subdivisions. A PowerPoint presentation describing the project is available here: Conservation Subdivision Parcel Selection
Examples of Output Generated for Clients
Resources:

Allen, S., Moore, S., Moorman, L., Moorman, C., Peterson, N., & Hess, G. (n.d.).  Conservation Subdivision Handbook (North Carolina Forest Service and North Carolina State University Publication No. AG-742). Retrieved from http://www.ces.ncsu.edu/forestry/pdf/ag/ag742.pdf.

Allen, S., Moorman, C., Peterson, M.N., Hess, G., & Moore, S. (2013). Predicting success incorporating conservation subdivisions into land use planning. Land Use Policy, 33, 31–35. http://dx.doi.org/10.1016/j.landusepol.2012.12.001. (Article in its entirety is available at http://www4.ncsu.edu/~mnpeters/documents/Allen_etal_2013_LUP_000.pdf .)


Tuesday, July 29, 2014

GIS 4102 Module 10 - Creating Custom Tools

Learning about script tools this module was quite awesome. The use of parameters instead of hard-coded information as is used in stand-alone scripts provides so much flexibility and transferability of the script. Another advantage of script tools over stand-alone scripts is that message statements which are written to a progress dialog box and the Results window can be in a script tool. This allows the retrieval of results messages at a later time. Stand-alone script messages are printed to the interactive window and cannot be retrieved later. While the use of stand-alone scripts requires some knowledge of Python, the use of script tools does not require knowledge of Python. The script tool's dialog box is a convenient way for users to enter parameters with validation and error-checking included. The script tool window for this assignment is shown here:
Script Tool Window Showing Parameters Ready for Input
Even the creation of a script tool is relatively easy. After verifying that the stand-alone script forming the basis of the script tool works properly, a new script tool is added to a toolbox in ArcMap's Catalog. The new script tool is given a name, label, description, script file, and so on before parameters are added. After properties for each parameter are set, the original stand-alone script is edited to replace hard-coded filepaths or file names with the applicable parameters from the script tool. Print messages in the stand-alone script are replaced with message statements. This image shows the messages after running the tool for this assignment:
Resulting Messages from a Script Tool Which Clips
Several Layers to a Single Feature
Once the performance of the script tool has been confirmed, the script and toolbox containing the script tool can be zipped together into a folder. Voilà! It's ready to share with anyone else. Just for fun, I emailed the zipped file to myself and used it with some other data. Here's an image of Orange County, Florida, with roads and some other features clipped to the county line...another demonstration of the incredible functionality and adaptability of Python scripting:
Orange County, Florida, with Features Clipped Using Script Tool

Friday, July 25, 2014

GIS 4102 Module 9 Assignment: Debugging & Error Handling

Figure 1
First Script - List of Airports
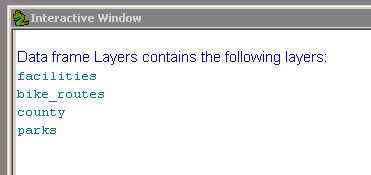
Debugging and handling errors were emphasized in this week's module. Having experienced quite a bit of debugging my own scripts in this course, especially with syntax and using the technique of commenting out sections of code, this exercise and assignment were extensions of that but also included try-except statements. The first script, with results shown here, contained two relatively easy syntax errors which allowed the script to run after correction. A list of airports was printed as a result (Figure 1).


Finding the eight errors in the second script took longer. The errors in the second script included misspellings, incorrect punctuation, and arguments along with incorrect mxd and path names. Once corrected, the script printed out a list of layers in the data frame as shown in Figure 2.

Figure 2
Second Script - Layers in Data Frame
Although in retrospect it was relatively easy, the third script took the longest. This was due primarily to determining where to place the try-except statement which, once placed correctly, allowed the script to run through to completion with an error message being printed for Part A and select data frame properties being printed for Part B. These results are shown in Figure 3.

Figure 3
Third Script - Error Message and Specified Data Frame Properties 

The step-through mode of the debugger was quite helpful for this assignment. All the techniques for error and exception handling will be very useful in future assignments during the course and employment.

Sunday, July 20, 2014

GIS4102 - GIS PROGRAMMING: Participation Assignment #2 ~ GIS for Monitoring Animal Diseases

GIS has been shown to be of benefit in the field of veterinary science. In her 2001 paper, "Geographical Information System (GIS) as a Tool in Surveillance and Monitoring of Animal Diseases", published in Acta Veterinaria Scandinavica, Madelaine Norstrøm overviewed the possibilities and potential uses of GIS with respect to animal diseases.

Along with a general description of GIS, Norstrøm noted that tables of information could be joined with geographical data utilizing a common identifier (ID). She mentioned that numbers are preferable for IDs to reduce the chance of misspellings with character variables. The easily understood format of a map can be used to report disease information (incidence, prevalence, mortality, and morbidity) at the farm, region or national level. Density maps can be used in movie format to show the spread of disease. Real time outbreak notification is possible as is updated information for farm personnel and reports for authorities and the media. This use would be especially beneficial during an emergency situation.

Western Fjord Cattle
Photo Credit: 
 Anna Rehnberg
http://sciencenordic.com/endangered-norwegian-livestock-hanging
Using GIS, the locations of the case farm and at-risk farms can be identified in the event of an infectious disease outbreak. Buffer zones can be created around these as well as other risk areas such as markets, roads, and slaughter houses. With this information, veterinary personnel can develop a plan of action. Norstrøm stressed the importance of performing a cluster analysis related to time and space to minimize misinterpretation of visual point patterns on maps. The integration of simulation models within a GIS utilizes risk factors for the spread of disease.

Norstrøm continued with an explanation of what data is available and where to obtain it. She mentioned that the goal is to have maps continuously displaying each disease's status. Norstrøm concluded with two specific examples of GIS use for specific swine and cattle diseases.


Friday, July 18, 2014

GIS 4102 – GIS Programming Module 8 – Working with Rasters

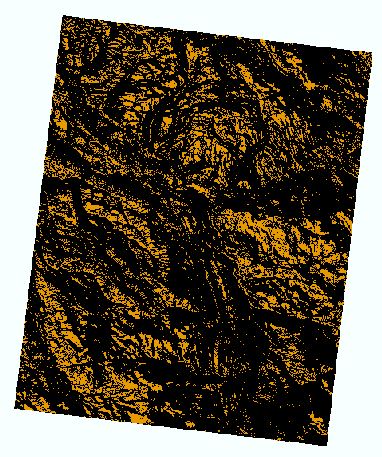
The purpose of this week's lab assignment was to produce a composite raster from 5 intermediate rasters which were created using various aspects of  the spatial analyst extension. After writing code to determine whether the spatial analyst extension was available, it was checked out, and the fun began. Three land cover classifications were assigned identical values; reclassification of the land cover raster was based on those new values. From the elevation raster four intermediate rasters were created based on slope and aspect values (slope between 5-20° and aspect between 150-270°). Finally, the five temporary rasters were combined into one raster which was saved, and the spatial analyst extension was checked in.


Final Raster Depicting Landcover Classification 1,
Slope 5-20°, and Aspect 150-270°
The main problem that I had with this particular script was that the outcome did not match the sample provided in the lab instructions. I had three colors in ArcMap instead of two. A big concern is that I would not have caught this error (since my script ran without trouble or messages) except that I was able to make this comparison and noticed the difference between my results and the lab instructions sample. The resolution of this issue turned out to be rather simple.

Because I remembered being confused by the inclusion of “NODATA” as a parameter in the reclassify portion of the lab exercise on p. 17 which is what I modeled my script on, I revisited that information in the text and learned that the 4th parameter is optional. I removed “NODATA” from my script, ran it again, and got the desired results, shown here.

With the completion of each lab, I am more impressed by what can be done in ArcMap with Python. I'm looking forward to the next lab!

Thursday, July 17, 2014

GIS 4048 Urban Planning: GIS for Local Government

The study of local government continued with this lab which was composed of two scenarios.

Scenario 1 involved students as GIS Technicians employed by the Marion County Property Appraiser's office. The county property appraiser's website and online map were utilized to provide information to a local developer who was interested in the impacts a Fly-In Community would have on property owners adjacent to a specific parcel of land in the county. His request for a preliminary zoning report of the site and adjacent areas was met with a PDF map book and a PDF of contact information for the owners of parcels within 1/4 mile of the subject parcel. The map book was created with data driven pages and included an index map. Each page of the map book focused on one particular area that was overviewed in the index map. Although this project had to do with zoning, creating something reminiscent of DeLorme Atlas and Gazetteers was very gratifying. The fact that the pages are so easily editable is very exciting.

After verifying the certification date of the data, the appraiser's website was navigated to develop a familiarity with it. The Marion County Property Appraiser had very detailed information for the subject parcel. (Something that would have made my own dog quite jealous was discovering the assessed value of $6,500 on the property's doghouse.) This particular website allows the buffering of parcels and downloading of data in .csv format. This data was used to add parcel owners' names to the data already provided using Join in ArcMap. The colors for the different zoning classifications were selected to correspond to the actual colors used in the county property appraiser's zoning map. This would develop a familiarity and provide a reference to the client. Each parcel within a 1/4 mile of the subject parcel was assigned a Map Key identifier. These numbers were also used in the corresponding Parcel Report PDF. Compiling the map book involved using this data and a selection of parcels within 1/4 mile of the subject parcel coupled with the zoning information and streets for reference. The index map for the map book was created to identify which portion of the overall map was the focus of a particular page in the map book. Labeling in data-driven pages is something that I found to be more complicated than labeling  layers in a standard map. With more practice that, too, should become second nature.

After completion of the data-driven pages and addition of final touches to the map, the map was exported to a PDF file to be provided to the client. Also provided to the client was a corresponding report of the parcels (identified by Map Key) with parcel ID, owner's name and address, zoning code, and acreage. This report was in PDF form. Generating a report from the attributes will be a handy skill to have. One page of the multi-page map book is included here:
Preliminary Zoning Report - Parcel No. 14580-000-00 and Adjacent Areas
Sheet B4, Page 6 of 12 in Map Book 
The second scenario of the lab exercise involved providing Gulf County Board of County Commissioners with a PDF list of vacant, county-owned parcels greater than 20 acres which they could consider for the construction of a future Extension office. Completion of this task required merging two parcels and then using editing tools to separate out a portion of the new parcel using a legal description. The new parcel's attribute information was then updated along with the new acreages for each of the two parcels. Selecting by Attributes yielded 75 parcels owned by Gulf County. A Definition Query utilizing Query Builder yielded 11 properties of more than 20 acres. Finally, a Vacant-Improved Code (VICD) Table was joined to the layer, and from this three vacant parcels were located. The results were organized in an attribute report which was exported as a PDF to be provided to the Board of County Commissioners.